
You spend hours on social media. Writing captions, replying to comments, keeping the grid or the feed ticking over. But do you actually know if any of it is working?
Most small business owners don’t. They’re posting on instinct, not on evidence. That means they’re just as likely to be repeating what doesn’t work as what does.
Social media reporting fixes that. It turns your activity into a system you can actually manage: what’s driving engagement, what’s driving traffic, what’s driving sales, and what’s a waste of your time. Sorted properly, it stops being a guessing game and starts being a system that works whether you’re watching it or not. That’s exactly what a Systems-pillar problem should look like.
In this post, you’ll get:
- The social media metrics actually worth your attention (not all 200+ your dashboard offers)
- How to spot your best-performing content and your best posting times
- A five-step monthly reporting process you can run in under an hour
- Why the right tool does most of this for you, and which one we rate
Let’s start with the bit most businesses get wrong.
Why social media reporting matters for small businesses
Posting without reporting means mistaking activity for progress. A post can rack up fifty likes and generate zero business. A post with three comments can quietly bring in a client. Without data, you can’t tell the difference, so you end up making decisions on vibes.
The problem with posting on guesswork
It’s easy to chase vanity metrics: likes, follower counts, the numbers that feel good but rarely move the needle. Common patterns that eat time without building anything:
- Publishing without measuring the result
- Repeating a content format that isn’t actually working
- Posting when your audience is offline
- Pouring effort into a platform that gives nothing back
- Making calls based on assumption instead of evidence
None of these are fatal on their own. Stacked up over months, they’re the reason “I post all the time and nothing happens” becomes the story.
What reporting actually changes
Reporting turns raw activity into decisions. Instead of guessing which post worked, you can see it: maybe your how-to videos consistently beat your promo posts, or your client stories out-click your industry news shares. That’s not a hunch anymore. It’s a pattern you can build a content plan around.
Done consistently, reporting gets you:
- Clarity on which platform is actually earning its place in your week
- A read on how your audience behaves, not how audiences behave “in general”
- A tighter posting schedule based on real activity, not guesswork
- Proof of what your marketing time is actually buying you
The businesses that grow fastest on social media usually aren’t posting more than everyone else. They’re learning faster from what they’ve already posted. That’s the whole point of a reporting system: it turns every post into a data point that makes the next one better.
What social media reporting actually is
Social media reporting is the process of pulling data from your channels and turning it into decisions. Not just numbers on a screen. What those numbers mean, and what to do next.
Reporting vs. analytics: they’re not the same thing
Analytics is the raw data: impressions, reach, clicks, follower growth, video views. It answers “what happened?”
Reporting takes that data and turns it into a call: which content type to make more of, which posting time to lock in, which platform to keep investing in. It answers “what do we do about it?”
Analytics is the ingredients. Reporting is the meal. You need both, but reporting is where the actual value sits.
What a proper social media report includes
Keep it to what matters, not everything your dashboard offers:
Performance overview. Reach, impressions, engagement, website clicks, follower growth, conversions. A snapshot, not a spreadsheet dump.
Audience insights. Growth trends, demographics, location, active hours. This is what tells you who you’re actually reaching, not just how many.
Content analysis. Your top posts, best formats, what’s driving clicks. This is where the repeatable patterns live.
Growth trends. Month-on-month, quarter-on-quarter, seasonal blips. One good month tells you nothing. Three months in a row tells you everything.
Recommendations. The part most businesses skip, and the part that actually matters. A report without a “so do this next” line is just a collection of numbers.
The social media metrics actually worth tracking
Your dashboard offers you hundreds of numbers. Most of them won’t change a single decision you make. The job isn’t to collect more data. It’s to know which handful of numbers actually earn their place in your report.
Engagement metrics
Likes are the easiest metric to see and the least useful on their own. Compare them across content types rather than chasing a total.
Comments take more effort from your audience than a like does, so they’re a stronger signal. Watch for volume, sentiment, and repeated questions. Those questions are often your next piece of content, sitting right there for free.
Shares put your content in front of people who’ve never heard of you. High-share posts tend to be useful, emotional, or genuinely worth passing on.
Saves matter more than they get credit for, especially on Instagram. A save means “I want this later.” Tutorials, checklists and how-tos tend to rack these up even when the like count looks modest.
Engagement rate (interactions relative to reach or audience size) is usually the single most useful number to track over time, because it accounts for the fact your audience isn’t the same size every month.
One thing worth knowing before you benchmark yourself against “industry average” engagement rates: don’t trust a single figure. Socialinsider’s 2026 benchmarks report, built from over 70 million posts, puts TikTok engagement somewhere around 2.6 to 2.7%, while other 2026 studies using different methodology put the same platform closer to 4%.
The gap between reports is huge, and that’s exactly why chasing an industry number is a waste of time. Your own historical data is the only benchmark that actually means anything for your business.
Reach and visibility metrics
Reach is unique users who saw your content. The closest thing to “is my audience actually growing.”
Impressions count every view, including repeats from the same person. Compare the two and you’ll see whether people are seeing your content once or several times.
Profile visits tell you when curiosity tips over into interest. Someone liked what they saw enough to go look at who posted it.
Follower growth matters less as a total and more as a trend: net new followers, growth after a specific campaign, and, just as tellingly, where you’re losing people.
Content performance metrics
This is where reporting earns its keep, because it tells you exactly what to make more of.
- Top-performing posts. Topic, format, CTA, timing. Patterns show up fast once you’re looking at five or six posts side by side.
- Video views, watch time, completion rate. Tells you whether people are watching or scrolling past.
- Click-through rate. How often people actually act on your CTA.
- Website traffic from social. Connect your platforms to Google Analytics and you’ll see which channel earns its keep beyond the platform itself.
Conversion metrics
Engagement and reach get the attention, but these are the numbers with the strongest tie to revenue:
- Leads generated. Inquiries, form fills, bookings that started on social.
- Sales attributed to social. Revenue by platform, by campaign, by content type.
- Conversion rate. The percentage of people who actually do the thing you asked.
- Cost per acquisition. For anyone running paid social, this is the number that decides whether a campaign is worth scaling.
Pick metrics that match your goal, not your dashboard
If your goal is awareness, reach and engagement matter most. If it’s leads, watch traffic and conversions. If it’s sales, watch attribution. Trying to track everything at once is how reporting turns into a chore nobody keeps up with.
How to find your best-performing content
Knowing what to track is half the job. The other half is knowing what the numbers are actually telling you.
Look past the like count
Picture two posts. Post A gets 500 likes and zero website visits. Post B gets 100 likes, 50 site visits, and three inquiries. Post B is the better post, even though it looks weaker on the surface. This is exactly why reporting has to look at engagement, shares, saves, clicks, traffic and leads together, not likes in isolation.
What to look for once you’ve found your winners
Topics. Certain subjects consistently outperform others. A landscaper might find lawn-care tips beat every promo post. A consultant might find tutorials beat industry commentary. Track it and you’ve got your content calendar written for you.
Formats. Short video might beat static images. Carousels might drive more saves. Client stories might convert better than anything else you post. Once you know, you stop guessing.
Posting frequency. More isn’t automatically better. Reporting tells you whether posting daily is actually working, or just creating more work for the same result.
Audience response. Comments, DMs and questions often tell you more than any metric does. FAQs, objections, and requests for more info are free content ideas sitting in your inbox.
Turning patterns into a system
A workable monthly loop looks like this:
- Review your top posts each month
- Spot the recurring themes and formats
- Make more of what’s working
- Test one new idea alongside your proven winners
- Measure, then repeat
Do this consistently and every post you publish makes the next one smarter. This is the part manual reporting struggles to sustain, and exactly where the right tool changes things.
Best time to post on social media: what your data actually says
Everyone wants a single “best time to post” answer. It doesn’t exist. A restaurant peaks at lunch and dinner. A B2B consultancy peaks during office hours. An ecommerce brand peaks evenings and weekends. Generic advice can’t account for any of that. Only your own data can.
Why the generic posting-time lists don’t hold up
Every “best time to post” listicle is built on someone else’s audience, not yours. It might get you in the right ballpark. It won’t get you the actual answer.
Finding your best time using your own numbers
Look across several weeks or months, not one lucky post, for:
- Hours that consistently outperform
- Days of the week that consistently win
- Differences by content format
- Seasonal shifts in behaviour
Then run a simple test: pick two or three posting windows, publish similar content in each, and compare engagement, reach, clicks and conversions. Adjust your schedule to match what actually happens, not what a blog post told you would happen.
A quick word on platforms
Facebook. Engagement tends to spread across the day, especially evenings and breaks.
Instagram. Varies heavily by format (Reels vs. carousels vs. Stories), so check each separately.
LinkedIn. Skews weekday, business hours, unsurprisingly.
X. Moves fast. Reporting helps you catch the short window where a post is actually visible.
TikTok. The algorithm can resurrect old posts, but activity data still helps you land the first push.
As your posting volume grows, working this out by hand across five platforms becomes a proper time sink. That’s where a dedicated reporting tool earns its keep.
Social media reporting tools for small businesses
Manual reporting is fine at a small scale. Once you’re active on more than one or two platforms, it turns into hours a month spent exporting numbers into a spreadsheet instead of running your business.
What to look for in a reporting tool
Ease of use. If you need an hour to read your own dashboard, the tool has failed at its one job.
Multi-platform reporting. One view across Facebook, Instagram, LinkedIn, TikTok, Pinterest and X beats logging into five separate dashboards.
Automated reports. Scheduled, downloadable, ready to send to a client or just to yourself.
Scheduling built in. Publish, measure, adjust, repeat, without switching tools.
Reasonable pricing. You don’t need enterprise software to run a small business’s social media.
Manual reporting vs. software
Spreadsheets work until they don’t. Once you’re juggling more than one platform, manual reporting means logging in repeatedly, exporting data, calculating trends by hand, and building charts from scratch. It’s an easy process to let slide the moment things get busy.
Software does the collecting and the calculating for you, and, more usefully, nudges you toward what to actually do about the numbers.
Signs it’s time to upgrade from spreadsheets
- You’re active on more than one platform
- Reporting eats over an hour a month
- You can’t tell what’s actually working
- You want scheduling and analytics in the same place
If any of that sounds familiar, it’s worth the switch. And this is exactly where Metricool comes in.
Metricool review: the tool we actually recommend for reporting
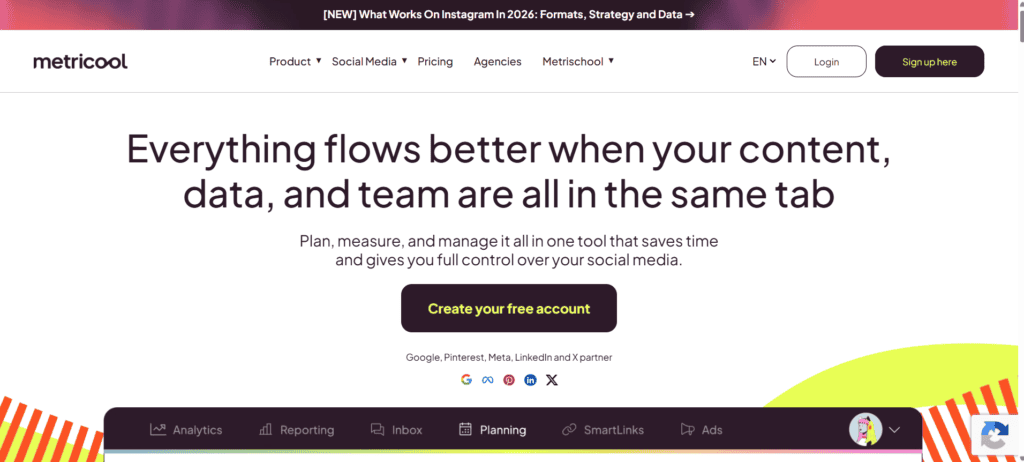
Most small business owners don’t struggle to get data. They struggle to turn it into something useful without losing an evening to it. That’s the specific problem Metricool solves, and it’s why the reporting side of it is the strongest reason to use the platform at all.
Try Metricool here, and if you’re only using it for one thing, make it the reporting. It’s genuinely one of the best reporting functions on the market at this price point.
What Metricool does
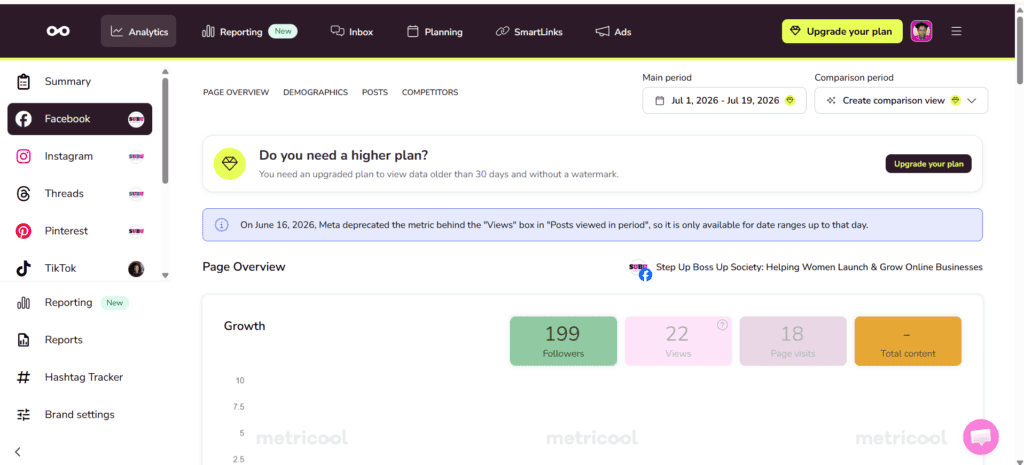
Metricool combines scheduling, analytics, reporting and competitor tracking in one dashboard, across most major platforms. You plan content, publish it, and see the results without switching tools. That means you can go from “that post did well” to “so let’s do more of that” in the same sitting.
The reporting features that matter
Cross-platform analytics. One dashboard instead of five logins. You get a single answer to “how’s my marketing doing,” not five separate ones you have to mentally stitch together.
Automated reports. Built and formatted for you, ready to send to a client or just to check yourself, without an evening lost to spreadsheets.
Content performance tracking. Top posts, engagement trends, growth patterns and top formats, laid out so the pattern is obvious rather than something you have to dig for.
Competitor tracking. Useful context on posting frequency and growth, though it should inform your strategy, not dictate it.
Best posting time suggestions. Built from your actual audience data, not a generic industry list.
Where it’s strong, and where it isn’t
Strong on: reports that make sense without a data background, pricing that suits a small business rather than an agency retainer, scheduling and reporting living in one place, and dashboards that are genuinely easy to read at a glance.
Worth knowing: if you need heavy customisation, you may eventually want more than the platform offers, though most small businesses won’t hit that ceiling. Some features sit behind paid tiers, so check the plan matches what you actually need before committing.
Why it’s a good fit for a small business specifically
Most social platforms are built with enterprise marketing teams in mind. You don’t have that team. You need something that saves time, tells you what matters without a translation layer, and doesn’t get more expensive than it’s worth as you grow. Metricool does that: reporting, scheduling and tracking in one place, without needing a marketing degree to read the results.
Building a simple monthly social media report
You don’t need advanced analytics skills to do this properly. A five-step monthly check-in is enough to keep improving.
1. Gather your performance data. Reach, impressions, engagement rate, shares, saves, clicks, follower growth, leads, conversions, revenue where you can attribute it. Pick what matches your goal, not everything your dashboard offers.
2. Spot your wins and losses. Which posts performed, which flopped, and what pattern connects them. One outlier post isn’t a pattern. Three similar posts performing the same way is.
3. Compare against your goal. Growth mattered? Check followers. Leads mattered? Check clicks and conversions. Metrics only mean something once you know what you were aiming for.
4. Turn it into a decision. Every report should answer: what do we do differently next month? If it doesn’t, it’s not a report, it’s a list of numbers.
5. Adjust and repeat. Update your content calendar, your posting times, your platform priorities. Small adjustments compound fast when you’re doing this every month instead of once a year.
A simple template to keep it manageable
- Executive summary: the headline in two sentences
- Key metrics: the handful that matter this month
- Top-performing content: what worked and why
- Areas to improve: what didn’t, and what you’ll change
- Action plan: the specific thing you’re doing differently next month
Common social media reporting mistakes to avoid
Tracking too many metrics. More data isn’t more insight, it’s more noise. Match your metrics to your goal: awareness needs reach and impressions, engagement needs rate, comments and shares, traffic needs CTR and visits, leads need form fills, sales need conversions and revenue.
Ignoring your actual goal. You can hit record engagement and miss your revenue target completely. Set the goal before you read the report, not after.
Reporting numbers without analysis. “Engagement up 12%” tells you nothing on its own. Why did it go up? What should you do because of it? A report that doesn’t answer those questions is a history lesson, not a strategy tool.
Not acting on what you find. This is the expensive one. If your data says educational videos consistently beat promo posts and you keep making promo posts anyway, the reporting was a waste of time. Every report should change at least one thing about what you do next.
FAQs
How often should a small business run a social media report? Monthly is the sweet spot for most small businesses. Frequent enough to catch patterns, infrequent enough that you’re not chasing noise from a single post.
What’s the difference between reach and impressions? Reach counts unique people who saw your content once. Impressions count every view, including repeats from the same person.
Do I need a paid tool, or can I report manually with spreadsheets? Spreadsheets work fine at a very small scale, one platform, low posting volume. Once you’re active on more than one channel or reporting starts eating over an hour a month, a tool like Metricool pays for itself in time saved alone.
What’s a good engagement rate to aim for? There isn’t a single reliable number. Published 2026 benchmarks for the same platforms vary by 2x or more depending on methodology. Track your own trend over time instead of chasing someone else’s average.
Bring it back to systems
Reporting isn’t about collecting more numbers. It’s about building a system that gets a little smarter every month without you having to reinvent it from scratch each time.
Track the metrics that actually connect to your goal, review them on a simple monthly rhythm, and let a tool like Metricool do the heavy lifting on the reporting side so you’re spending your time acting on the data instead of collecting it.
If you’re comparing the rest of your marketing tech stack too, Systeme.io is worth a look for the all-in-one funnel side, and Payhip if you’re selling digital products directly.
Full breakdowns of both in the reviews linked, or start with the full roundup of the best marketing tools for small business in 2026 if you want the complete picture.